The Evidence
The Federal Reserve's Own Data
Makes the Case for V12
Every dollar figure cited by V12 comes directly from official Federal Reserve Payments Studies and Visa's published interchange fee schedules — primary sources that any citizen can verify independently. This page presents that data plainly, shows what it means for ordinary Americans, and explains exactly how V12 addresses what the numbers reveal.

The Growth of Noncash Payments in America
The Federal Reserve has tracked noncash payment trends in the United States since 2000 through its triennial Payments Studies. The three most recent studies — covering data through 2018, 2021, and 2022 — paint a clear picture: Americans are conducting an enormous and rapidly growing volume of electronic transactions every year, and they are paying billions of dollars in fees to banks and card networks for the privilege.
That fee revenue flows entirely to financial institutions. V12 is designed to redirect it to the 42,000 American citizens who operate Witness Nodes — the backbone of the network that processes those same transactions.
Table 1 — Noncash Payments: 2015, 2018, and 2021
Source: The Federal Reserve Payments Study: 2022 Triennial Initial Data Release
Reproduced from a U.S. federal government publication. Federal government works are in the public domain under 17 U.S.C. § 105.
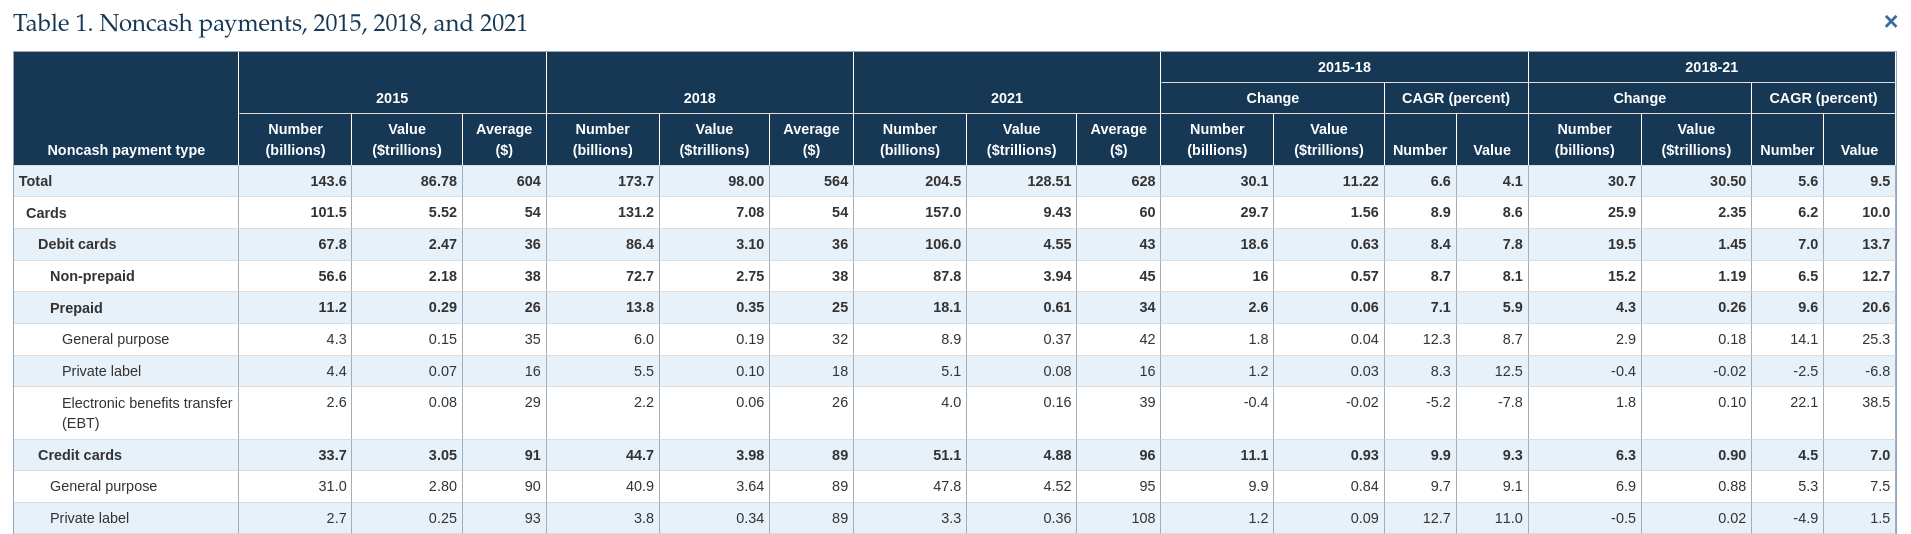
What This Table Shows
- Card transactions grew from 101.5 billion (2015) to 157.0 billion (2021) — a 55% increase in just six years.
- Total card transaction value reached $9.43 trillion over the 2019–2021 period, up from $7.08 trillion in 2016–2018.
- The average card transaction was $60 in 2021 — meaning the average American paid approximately $1.80 in hidden fees on every single card purchase.
- Non-cash payments now total 204.5 billion transactions per year, growing at a compound annual rate of 5.6% — a market expanding faster than the broader economy.
Figure 1 — Trends in Noncash Payments, by Value, 2000–21
Source: The Federal Reserve Payments Study: 2022 Triennial Initial Data Release
Reproduced from a U.S. federal government publication. Federal government works are in the public domain under 17 U.S.C. § 105.
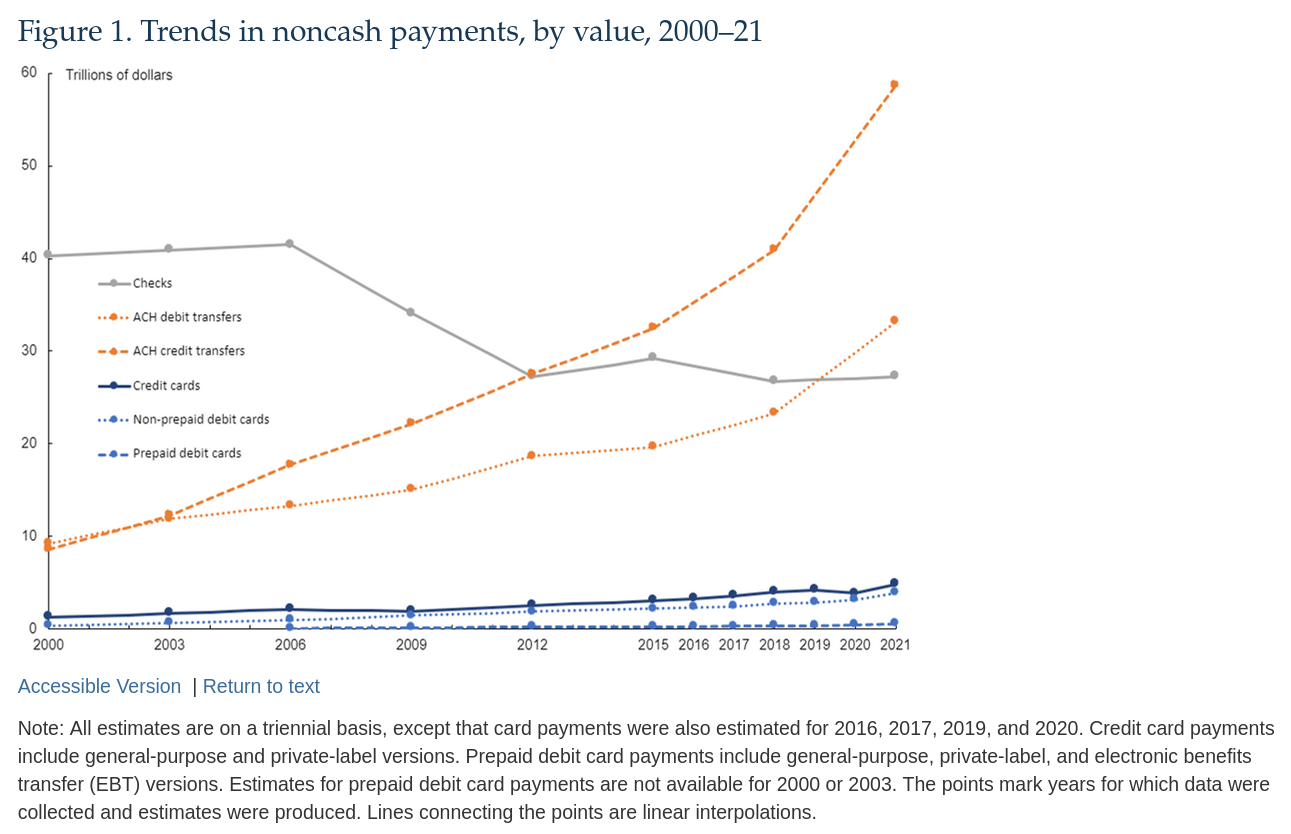
What This Chart Shows
- ACH credit transfers have exploded — growing from under $10 trillion in 2000 to nearly $60 trillion in 2021, reflecting the massive shift toward electronic payroll, bill payment, and business-to-business transfers.
- Check usage is declining but still represents trillions of dollars in annual value — a market that V12's payment network can absorb as adoption grows.
- Debit and credit card values have grown steadily since 2000 with no sign of slowing, confirming that the $8.4 billion annual fee opportunity V12 targets is a stable, long-term market — not a temporary trend.
Figure 2 — Trends in Noncash Payments, by Number, 2000–21
Source: The Federal Reserve Payments Study: 2022 Triennial Initial Data Release
Reproduced from a U.S. federal government publication. Federal government works are in the public domain under 17 U.S.C. § 105.
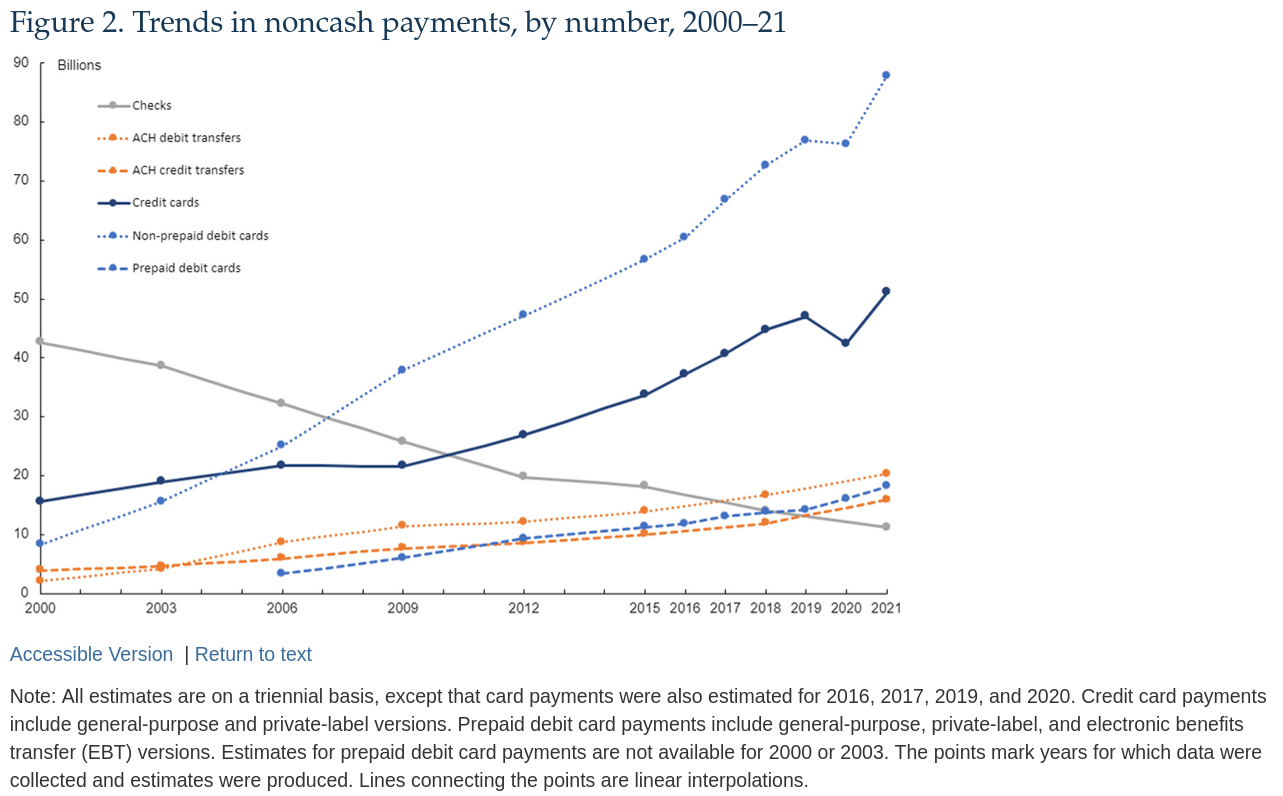
What This Chart Shows
- Non-prepaid debit card transactions reached nearly 90 billion per year by 2021 — the single largest category by number of transactions and the primary driver of V12's fee opportunity.
- Credit card transactions grew to over 50 billion per year, continuing their two-decade upward trend.
- Check transactions fell from over 40 billion to about 10 billion between 2000 and 2021 — almost entirely replaced by electronic payments, which are the transactions V12 is designed to process.
- Total card transactions now exceed 157 billion per year — confirming the 52.4 billion annual figure V12 uses in its revenue estimates is a conservative baseline drawn from the 2018–2021 average, not a peak.
The Hidden Tax
How Banks Extract $97.9 Billion From Americans Every Year
The math behind these numbers comes directly from the Federal Reserve Payments Studies and Visa's published interchange fee schedule.
The Flat Fee: $5.24 Billion Per Year
Banks charge a flat fee of approximately $0.10 on every card transaction. At 52.4 billion transactions per year (the 2018–2021 average), that flat fee alone generates $5.24 billion annually — paid by merchants, and passed on to consumers through higher prices.
The Percentage Fee: $92.6 Billion Per Year
On top of the flat fee, banks charge approximately 2.95% of the value of every card transaction. On $3.14 trillion in annual card transaction value, that percentage fee generates $92.6 billion per year — a hidden 3% tax on every purchase every American makes.
Total: $97.9 Billion Extracted Per Year
Combined, the flat fee and percentage fee total $97.9 billion per year — extracted from American merchants and consumers and paid to banks and card networks. This is not a profit for anyone in the real economy. It is a toll on every transaction.
V12 Replaces Both Fees With $0.16 Per Transaction
V12 eliminates the percentage fee entirely and replaces the flat fee with a transparent, fixed $0.16 per transaction. At 52.4 billion annual transactions, V12 generates $8.4 billion in total network fees — all of which flows equally to the 42,000 American citizens who operate Witness Nodes.
$89.5 Billion Returned to Merchants
By eliminating the 3% percentage fee, V12 returns approximately $89.5 billion per year directly to American merchants — reducing prices for consumers and injecting real economic value back into the communities where it was earned.
$200,000 Per Year Per Node Operator
The $8.4 billion in V12 network fees is split equally among all 42,000 Witness Node operators. That is $200,000 per year, per node — wealth that previously flowed exclusively to Wall Street banks now distributed to American households.
The Trend
A Market Growing Faster Than the Economy — Every Year
The opportunity grows every year — with or without V12
The question is not whether this market exists. The Federal Reserve's own data proves it does. The question is who captures the fee revenue it generates — banks, or American citizens.From $5.52T to $9.43T in Six Years
Between the 2013–2015 and 2019–2021 study periods, total card transaction value grew from $5.52 trillion to $9.43 trillion — a 71% increase in six years. The fee opportunity V12 targets grows with it.
From 101.5B to 157B Transactions in Six Years
The number of annual card transactions grew from 101.5 billion (2013–2015 average) to 157 billion (2021) — a 55% increase. Every additional billion transactions represents an additional $160 million in annual V12 network fee revenue shared among node operators.
Cash Is Disappearing
Every successive Federal Reserve Payments Study has confirmed the same trend: Americans are using cash less and electronic payments more. The 2019 and 2021 studies show the pace of this shift accelerating. V12 is positioned at the center of where the entire economy is already heading.
The 52.4B Figure Is Conservative
V12's revenue estimates use 52.4 billion annual transactions — the 2018–2021 three-year average. The 2021 annual figure alone was 157 billion total card transactions. As adoption grows, the baseline transaction volume V12 processes will grow with it.

How V12 Responds
What V12 Does With This Data
The Federal Reserve's numbers are not just a market opportunity — they define V12's entire mission. Here is how each finding maps directly to a V12 feature.
Flat $0.16 Fee Replaces a Broken System
The current dual-fee structure — $0.10 flat plus 3% of value — penalizes high-value transactions disproportionately. V12's flat $0.16 per transaction is the same whether you are buying a coffee or a car. Learn more on the V12 home page.
ANTELOPE Leap 5.0 Handles the Volume
157 billion annual transactions — over 4,900 per second at peak — requires infrastructure that can keep up. ANTELOPE Leap 5.0 processes thousands of transactions per second with sub-second finality. Read more on the ANTELOPE technology page.
EVM Smart Contracts Enforce the Fee Split
The equal distribution of $8.4 billion among 42,000 node operators is not a promise — it is enforced automatically by an on-chain smart contract that no individual can override. Read more on the EVM & Smart Contract Governance page.
Quantum-Resistant Encryption Secures Every Transaction
At 157 billion annual transactions, the volume of sensitive financial data flowing through V12 is enormous. Every transaction is protected by NIST-approved post-quantum encryption. Read more on the Quantum-Resistant Encryption page.
References
All data presented on this page is drawn from the following primary sources. Every figure, table, and calculation can be independently verified by any citizen using the links below.
- The Federal Reserve Payments Study: 2019 Annual Supplement Federal Reserve Board of Governors, December 2019. Covers noncash payment trends through 2018, including transaction counts, values, and growth rates by payment type.
- Findings from the Federal Reserve Payments Study Federal Reserve Board of Governors, December 2021. Covers noncash payment trends through 2020, including the impact of the COVID-19 pandemic on payment volumes and the accelerating shift away from cash.
- The Federal Reserve Payments Study: 2022 Triennial Initial Data Release Federal Reserve Board of Governors, April 2023. The most recent triennial study, covering full 2021 data. Source of Table 1 (Noncash payments by type), Figure 1 (Trends by value), and Figure 2 (Trends by number) reproduced on this page.
- Visa USA Interchange Reimbursement Fees Visa Inc. Published interchange fee schedule. Source of the $0.10 flat fee and 2.95% percentage fee figures used to calculate the $97.9 billion annual hidden tax estimate. See page 11.
The Federal Reserve Payments Studies are works of the United States federal government and are in the public domain under 17 U.S.C. § 105. Figures and tables reproduced with source attribution.
The Data Is Clear.
The Choice Is Yours.
The Federal Reserve's own numbers confirm that American consumers and merchants pay $97.9 billion per year in hidden transaction fees — fees that flow entirely to banks.
V12 replaces that system with a flat $0.16 per transaction, returns $89.5 billion to merchants, and distributes $8.4 billion equally among 42,000 American Witness Node operators — up to $200,000 per year, per node.
The math is not a projection. It is arithmetic applied to the Federal Reserve's own data.